

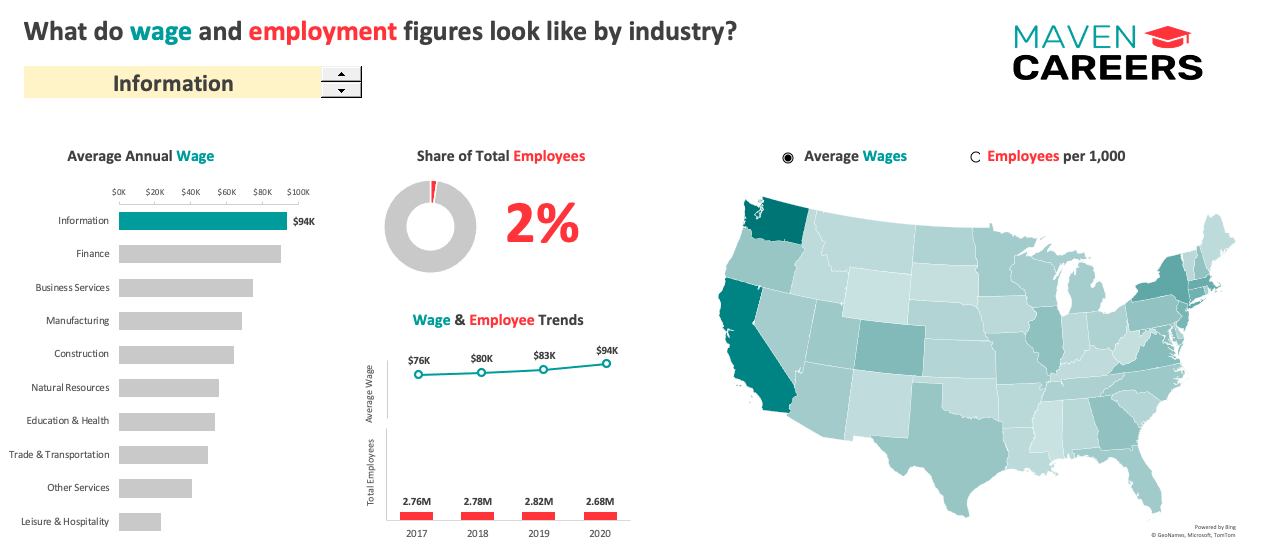
Created a dashboard that would help analyze different careers across different states in the USA. The average number of employees and average wages can be seen from the visuals created. This dashboard is intended to help high school students explore different career opportunities in the USA.
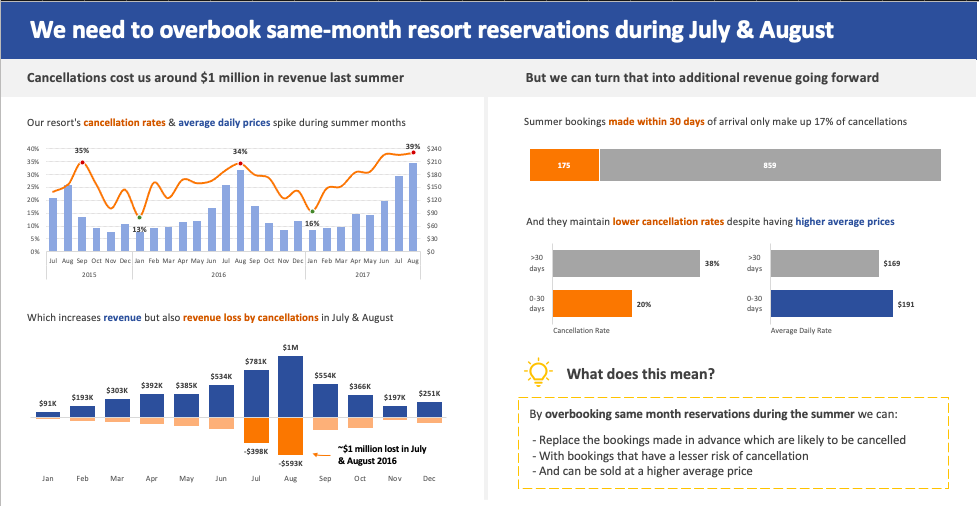
This dashboard analyzes the performance of Maven Hotel during July and August. The main problem arises from the cancellation of customers that costs the company around $1 million lost in revenue. It can be seen from the dashboard that during July and August are the months were the company loses the most sales. It can then be further analyze that overbooking same month reservations can help the company resolve the issue.
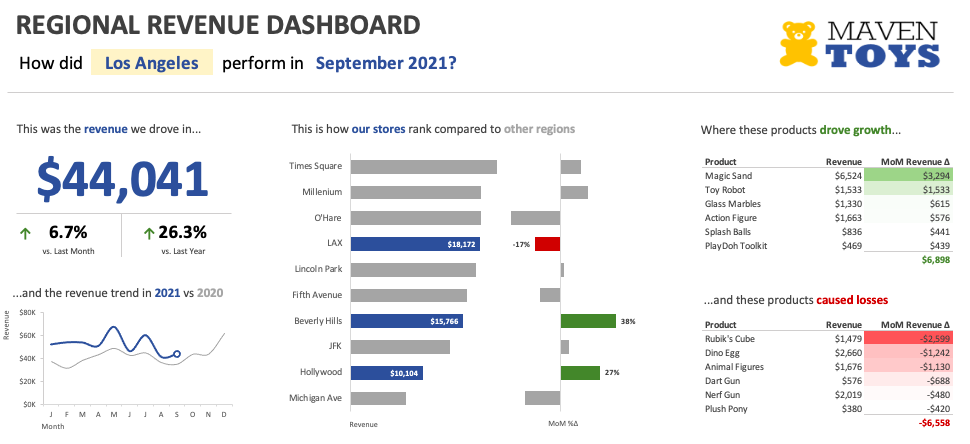
This dashboard summarizes the different perfomances of Maven Toys accross Los Angeles, Chicago, and New York. This dashboard is intended to be updated monthly as this is an interactive dashboard. This dashboard summarizes the total revenue that all stores made and it shows the monthly and yearly change. The dashboard also ranks the different store performances across the different cities and it also shows the products that made the company the most money and the products the company needs to address.